Spectroscopy
The study of atomic spectra is one of the oldest research topics in
"modern" physics. Theoretical descriptions of atomic spectra may be found
in a number of books dedicated to the topic, and introductory discussions
are available in the beginning textbooks of quantum mechanics. The excellent
book by Kuhn is at an intermediate level. Melissinos has an introductory
section on atomic spectra. Descriptions of optical instruments may be found
in Sawyer and in Jenkins and White. A brief summary of the absorption
spectra of gases is also included in these web pages.
Many of the features of atomic spectra can be explained using relatively
simple quantum mechanics. You should become familiar with the notation
and terminology used to desceibe atomic energy levels.
A. Procedure:
The apparatus to be used is shown schematically in Fig. 1. The central
component is a Jarrell-Ash quarter-meter spectrometer (or "monochrometer"),
described in Fig. 2. this instrument has fixed input and output slits,
and the spectrum is scanned by rotating the grating. Thanks to Mr.
Jung '96, this is now done by a computer-controlled stepper motor.
The light which passes through the exit slit is collected by a photomultiplier
and the output of the photomultiplier is measured by a picoammeter and
then digitized in the computer (data aquisition and display added by Frank
Hess in Summer '96.) Operation of the computer program SPEC.BAS is
described below
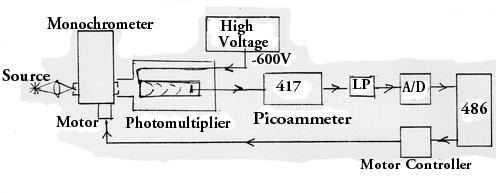
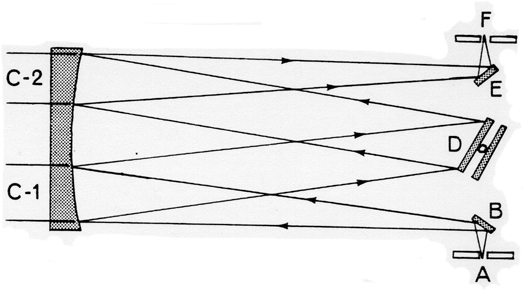
Figure 1: Schematic Diagram
-
A = Entrance slit
-
B = Mirror
-
C1 = Collimating mirror
-
C2 = Focusing mirror
-
D = Grating
-
E = Mirror
-
F = Exit slit
Figure 2: Monochrometer
The dial on the monochromator is reasonably accurate, but improved
accuracy should be obtained by using the mercury spectrum as a calibration.
Measure the (dial) wavelengths of the peaks appearing in the mercury spectrum
(by the procedure below) and identify as many as possible with known lines
(e.g. table in the Handbook of Chemistry and Physics.) Use lines
in second order diffraction, as well as first order. Note that some
lines are unresolved multiplets; choose what should be the strongest line.
Tabulate the differences (= correction.) Fit a straight line or other
simple curve, which can be used to apply the correction to other measured
spectra.
Turn on the high voltage power supply for the photomultiplier, wait
at least one minute, then turn on the high voltage switch.
Meanwhile turn on the computer, stepper motor power supply, picoammeter,
and fileter. All this before you start the scan, below.
The 486 computer contains a stepper motor controller card and an analog-to-digital
converter card. A program to control both cards for this experiment
has been written in Quick Basic. From the DOS prompt, type SPEC.
Click on Run in the menu bar, then Start. The program
then asks you for the settings of the spectrometer:
-
High or Low blaze. This tells the computer which of
two gratings is in place. Normally, use High. NOTE:
Do not press Enter here.
-
Current wavelength. Type in the number visible on the dial
inside the window associated with the blaze you have chosen. Warning!
It is important to give the (approximately) correct setting for the blaze
the computer thinks you are using. Otherwise the computer will try
to drive the grating beyond one of its stops, and may mess up the calibration,
if not the drive mechanism.
You now get the operating menu (most of which you never need.) With
Scan highlighted, press enter. Enter the low, then the high,
end of the wavelength range to be scanned. (By this point, the stepper
motor power supply should have been turned on.) The motor will run
the spectrometer to the low end on the range (if the sound of the motor
should change, due to grinding against a stop, turn off its power supply.)
Then the computer will ask for the scan rate. Try 14 for a fast scan.
the spectrum will be displayed as it is recorded.
You can determine wavelengths on the screen, using the two cursors and
the zoom feature. You may (?) be able to screen print to get a hard
copy. You can Quit and then save the spectrum to a permanent
file, which you can later import into a spreadsheet or graphics program
or examine in the editor. Note that a datum is recorded every 1/8
nm so the file can be quite long. the spectrum can be restored to
the screen using View last spectrum in the menu.
You can install another source and Scan without any further steps.
B. Characterization of Common Atomic Spectral Sources.
-
Using a mercury source, determine the corrections to be applied to the
monochromator wavelength readings.
-
Record spectra for H2, He, Na, and Rb.
-
Identify the major lines in the 200 - 800 nm range. You may want
to do a slow scan over a limited range of particular interest. Note
that shorter wavelength lines may also appear in second order.
-
Identify in addition to the strong lines, other medium strength lines which
are seen (change picoammeter scale and re-scan, if necessary).
-
Measure the relative heights of the various lines. Applying, if possible,
corrections for the phototube efficiency and the transmission of the spectrometer,
make up a table listing the lines you have identified with their relative
strength. (Normalize to the strongest line).
-
Make a Grotrian diagram for each source observed, identifying the transitions
leading to each spectral line observed. Relate to theory, in the
cases of the simplest spectra (see below.)
C. Other Spectra.
-
Obtain Light-Emitting-Diodes of three or more colors. Record their
spectra and also measure the voltage drop across the diode at its operating
current. Try to relate spectral peaks and the voltage drop to the energy
gap of the semiconducting materials. See, for instance, Kittel, Introduction
to Solid State Physics.
-
Study (an approximation to) blackbody spectra by recording the spectrum
of a high-intensity lamp. Repeat (at the same gain settings) using a Variac
to reduce the lamp voltage, and hence temperature. This will require
the corrections described in B.5 above. There may be small irreproducible
glitches due to the lamp.
-
Use the white-light source to study absorption spectra of filters, such
as the Hg light filters used in the Zeeman experiment. Can you see
absorption lines in a sodium vapor cell?
Useful Information
-
The photomultiplier is an EMI 9855. A voltage of -600 should be adequate
for part A. Never expose the photomultiplier
to room light with the high voltage turned on or off.
-
NO-NO'S:
-
Do note touch the discharge tubes in the middle section.
-
Do not touch the high voltage terminals.
-
WARNING! The mercury vapor lamp
has a fused silica bulb which transmits dangerous UV radiation. Do
not expose to the eye unless ordinary glass (which cuts off beyond
about 310 nm) intervenes.
References:
-
F.A. Jenkins and H.E. White, "Fundamentals of Optics", McGraw-Hill.
-
H.E. White, "Introduction to Atomic Spectra", McGraw-Hill.
-
H. Kuhn, "Atomic Spectra", Academic Press.
-
R.A. Sawyer, "Experimental Spectroscopy", Dover.
-
A.C. Melissinos, "Experiments in Modern Physics", Academic Press.
-
R.B. Leighton, "Principles of Modern Physics," McGraw-Hill.
Data on Atomic Spectra:
|
[All on Phys. Lib. Reference Shelf] |
-
W.F. Meggers et al., Tables of Spectral Line Intensities, NBS monogram
145, Part I [QC453. M4 pt. 1]
-
Relative intensities given; Transitions not explicitly identified
-
Wiese et al., Atomic Transition Probabilities, NSRO-NBS 22, vol.
I [QC 783. W5 (1966)]
-
Gives wavelengths, arranged in series
-
Striganov and Sventilskii, Tables of Spectral Lines of Neutral and Ionized
Atoms (Plenum Press, NY 1968)
-
Sec. III: By element and then by wavelength; intensities and spectral classification;
H, He, Ne, Na, K, CS
Spectroscopy: Suggestion on Analysis of Monochromator Data
-
Hydrogen. The exact solution is an elementary quantum mechanics problem
and you should be able to make detailed comparison with theory.
-
Helium. The low excited states involve one electron remaining in the ls
state and one excited to a higher state. Thus the energy levels have a
certain similarity to hydrogen levels, but there are more. For one thing,
the two electrons may have their spins either antiparallel or parallel,
giving rise to singlet and triplet levels.
-
Try to find as many lines as you can in each of the major series. (You
should be able to find practically all the lines shown in the Grotrian
diagram handout, and possibly some others). Can you estimate the series
limits?
-
Singly ionized helium (HeII) is analogous to hydrogen, so you should be
able to make accurate predictions of its spectral lines. Can you find the
lines within the accessible/wavelength range which you would expect to
be most intense (or put an upper limit on their intensity)? Note that there
must be at least some electrons and ions present in the discharge.
-
Sodium. Can you resolve the doublets? What is the resolution of our instruments?
(Why are doublets double?) From your knowledge of chemistry and physics,
what impurity line(s) would you most probably expect to see in this source,
and is it present?
-
Rubidium. to a first approximation, the series are the same as for
hydrogen, but with a correction (called the "quantum defect") to allow
for the overlap of the valence electron wavefunction with the core.
Estimate the center of a peak at half height. If the top of
the peak is cut off, you may have to measure at an unknown height.
this makes little difference if the peak is symmetrical. Peaks may
be asymmetrical because they are actually two or more overlapping peaks
(handle on a case-by-case basis); because you are sweeping too fast (i.e.,
the sampling rate exceeds the low-pass cutoff frequency); or because of
the properties of the spectrometer (the image of the entrance slit on the
exit slit is intrinsicly curved).