In this experiment we observe the splitting in a magnetic field of several emission lines of mercury. The data can be interpreted on the basis of the degeneracies, selection rules, and g-factors of the atomic energy levels.
Available magnetic fields up to 12 kilogauss (1.2 webers/m2)
produce lines splittings ![]() of a few tenths of a wavenumber (wavenumber, in cm-1, = 1/wavelength
in cm = frequency/c). This splitting is resolved with a Fabry-Perot etalon
(interferometer), after a single strong spectral line is selected by a
filter. The recommended spectral lines are at 546.1 nm (green), 435.8 nm
(blue), and 404.7 nm (violet), which constitute a "fine structure" triplet.
We have 1" diam. (or square) interference filters for each of these lines.
of a few tenths of a wavenumber (wavenumber, in cm-1, = 1/wavelength
in cm = frequency/c). This splitting is resolved with a Fabry-Perot etalon
(interferometer), after a single strong spectral line is selected by a
filter. The recommended spectral lines are at 546.1 nm (green), 435.8 nm
(blue), and 404.7 nm (violet), which constitute a "fine structure" triplet.
We have 1" diam. (or square) interference filters for each of these lines.
Some isotopes present in natural mercury have nuclear magnetic moments, which produce hyperfine splitting, with magnitude comparable to the Zeeman splitting we wish to measure. This is not a problem because about 87% of the strength (of the green line) is unshifted. There should be hyperfine components at -0.278 cm-1 (5%, from 199Hg) and +0.232 cm-1 (3%, 201Hg) as well as weaker components. You could look for these as an optional extension of the experiment.
The Zeeman splitting of the 546.1 nm line is given by Melissinos, p. 294 You should understand the reasons for the form of the splitting. Because the splitting is not fully resolved with our apparatus, you will want to know the relative intensities of the components, which are given here (as viewed perpendicular to the field).
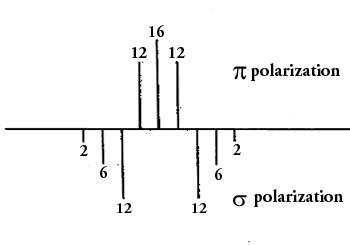
Figure 1.
The blue and especially the violet line appear less bright to the eye,
but this is compensated by splitting into fewer components in the magnetic
field.
We have both adjustable Fabry-Perot etalons and solid etalons. If you use an adjustable etalon you must make the mirrors exactly parallel.
Hint on adjustable Fabry-Perot alignment: Align roughly parallel with a HeNe laser, directed normal to mirrors. Observe a Hg source through the telescope, slightly defocused. Adjust FP slightly until fringes are seen in some portion of field. Adjust FP further to move region of sharp fringes towards the center of the field. This adjustment is very touchy. You can check the alignment by moving your eye (without the telescope) to look through different parts of the etalon. If the ring pattern expands and contracts as you move your eye, the mirror surfaces are not parallel by 1/2-wavelength per observed fringe shift.
It is probably easier to use one of the solid etalons. They are not perfect, and you can check them for parallelism as above, but they are pretty good. In interpreting your measurements, remember that the space between the mirror surfaces for the solid etalons is filled with fused silica, not air, and the refractive index of fused silica (see Handbook of Physics and Chemistry) comes into the optical path length. One etalon (in the brass mount, labeled "400 to 500 nm") is most useful for blue and violet, and is 1.00 mm thick. The other (in the black mount) may be more convenient for green, and is 2.00 mm thick.
WARNING: The Penlight mercury source has a fused silica jacket which transmits strong cornea-damaging ultraviolet radiation at 185.0 and 253.6 nm. Do not look at the source directly, only through ordinary or Pyrex glass (which absorbs wavelengths shorter than about 300 nm).
For this reason, always operate the mercury lamp inside a glass test
tube.
A least-squares fitting procedure may be preferable to the "square array"
procedure of Melissinos (p. 319).