

As the title suggests, this experiment makes use of a novel technique of collecting experimental data for atomic spectroscopy. The claim to fame of this new technique is to be able to collect as much data as possible within the least amount of time and with the greatest of accuracy. It has been possible to generate various parts of the Stark map of sodium in intricate detail using this method. A part of the Stark Map generated from our data is shown below.

Introduction
Atoms as we know them consist of dense, compact, positively charged nuclei surrounded by negatively charged electronic clouds. In the absence of any external field, the binding energies of the electrons surrounding the atomic core (the nucleus) can be calculated in atomic units (1= 27.2eV) as
E = -Z2/n2 where n is the principal quantum number of the electronic state.
In the presence of any external electric field, however, the degeneracy of the orbital quantum number is destroyed and then the states with the same principal quantum number are "split" into various energy levels corresponding to the orbital quantum numbers. This is known as the Stark splitting. The separation between the various energy levels into which the states split is a function of the applied electric field and is expressed as
D E= 3Fn/Z where F is the field in atomic units (1=5.14´ 109 V/cm). This is linear as long as the field is weak but in strong electric fields, the energy levels from states of different principal quantum numbers approach each other and there is a structure to the energy level diagram that can be calculated quantum mechanically from theoretical models. The set of states into which the state with the same principal quantum number splits is called the Stark manifold of that state. A plot of the allowed energy levels of the electronic states as a function of the applied electric field is termed a Stark map.
In this experiment we attempt to generate the Stark map of sodium.
A Schematic of the Experimental Setup
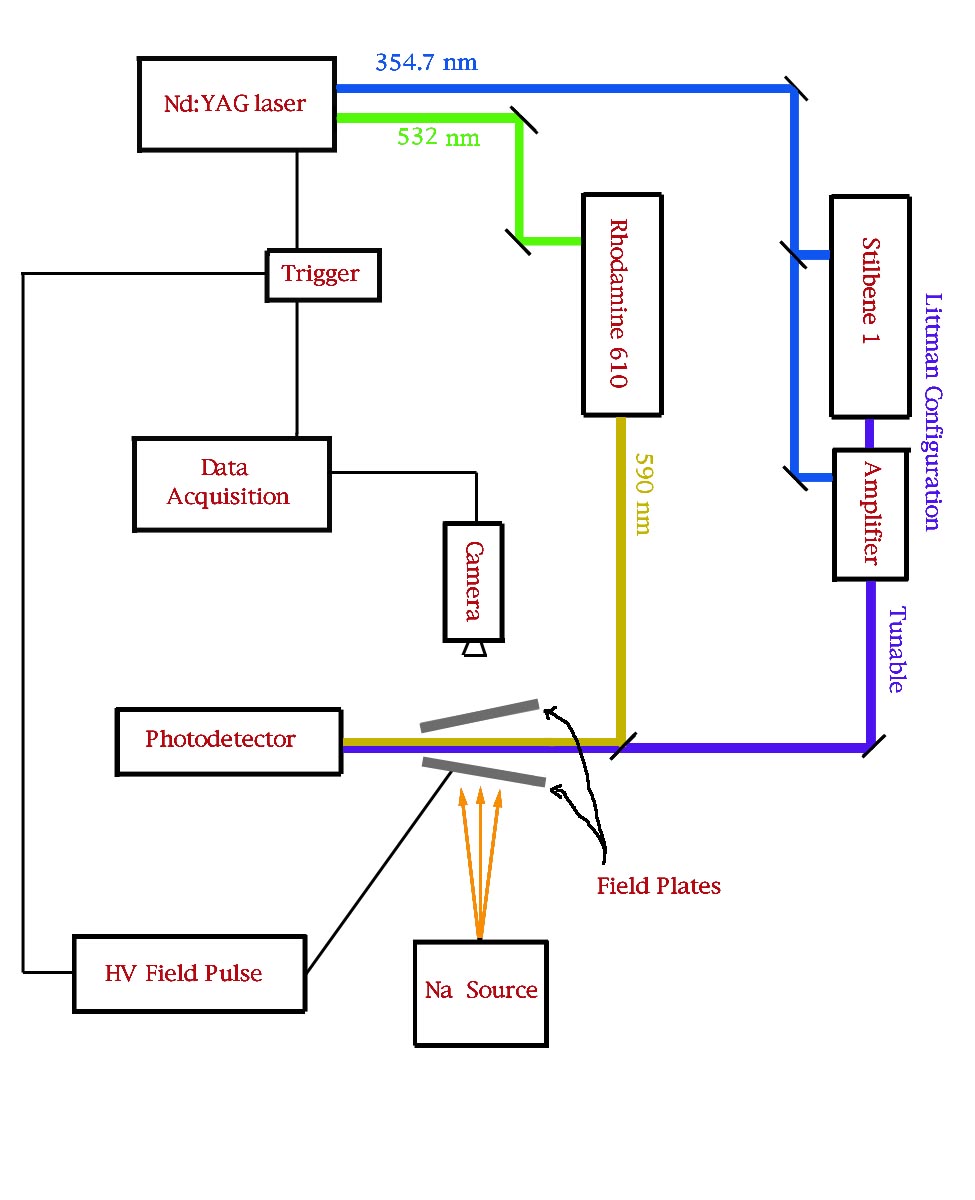
A Tunable Dye Laser with Amplifier
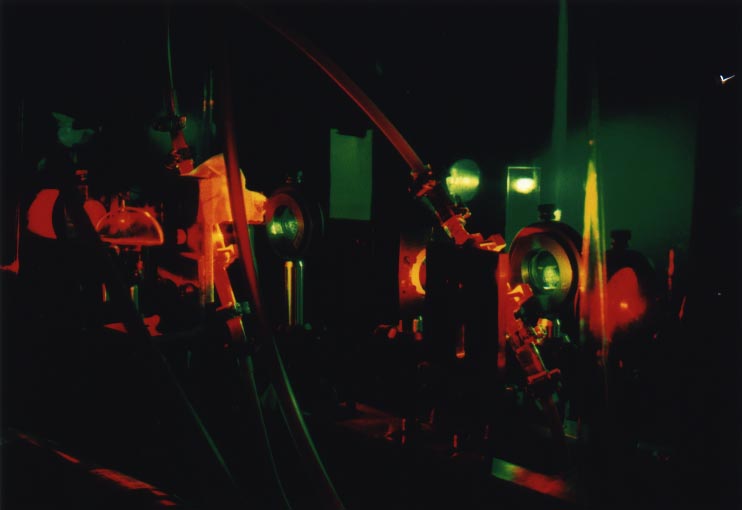
The laser in the photograph shown here is being pumped with a 532nm pulse from a Nd:YAG laser.
We generate a beam of thermally excited sodium atoms using an oven with a 400 m m diameter hole. These atoms form a jet that is directed into the interaction region. Sodium atoms in the ground state have one valence electron in the 3s state.
If one were to supply sufficient energy to these valence electrons to overcome the binding force to the nucleus, it would be possible to create free electrons and ions. If the electrons and ions were in an electric field, they would be accelerated in opposite directions. This is the basic principle of the detector that we have built for our experiment.
The energy to excite the valence electrons is supplied in two stages. The atoms are initially excited to the first excited state (3p) by a dye laser pulse at 590 nm. A second laser pulse from a tunable dye laser then excites them into higher ns and nd Rydberg states. A large electric field pulse is then applied which provides the additional energy needed to ionize these atoms.
In the presence of an external electric field, each nd state splits into a Stark manifold creating n-1 energy levels into which the atoms might be excited by the tunable dye laser. Then, as we increase the frequency of the laser, states with successively lower energies get excited and then ionized by the field pulse. It therefore becomes possible to generate an energy level diagram of sodium at any field by noting the number of ions produced as a function of the laser frequency.
Theoretical Calculation of the Stark Map of Sodium
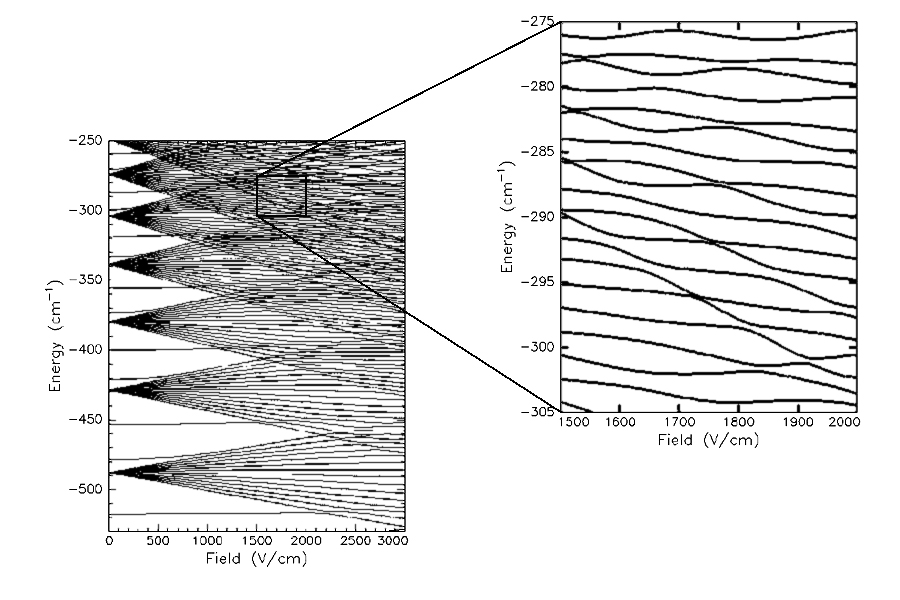
The Stark map of sodium generated from quantum mechanical calculations. This map has been generated by Matt Campbell.
A part of the Stark Map generated from experimental data
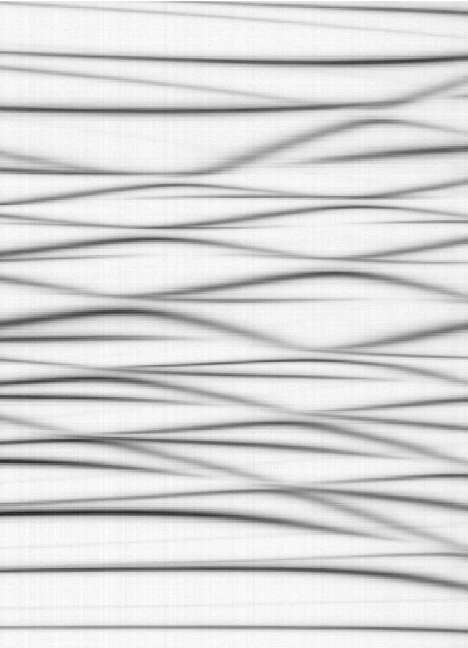
The data from one of our scans that closely matches the theoretical calculations was used to generate this image.
The Stark map generated with Earlier Methods
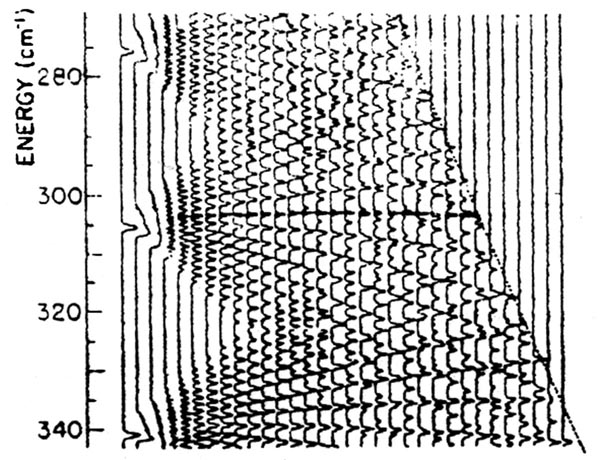
This is a Stark Map generated from several repeated scans of laser frequency at different fields published previously by Kleppner and others at MIT.
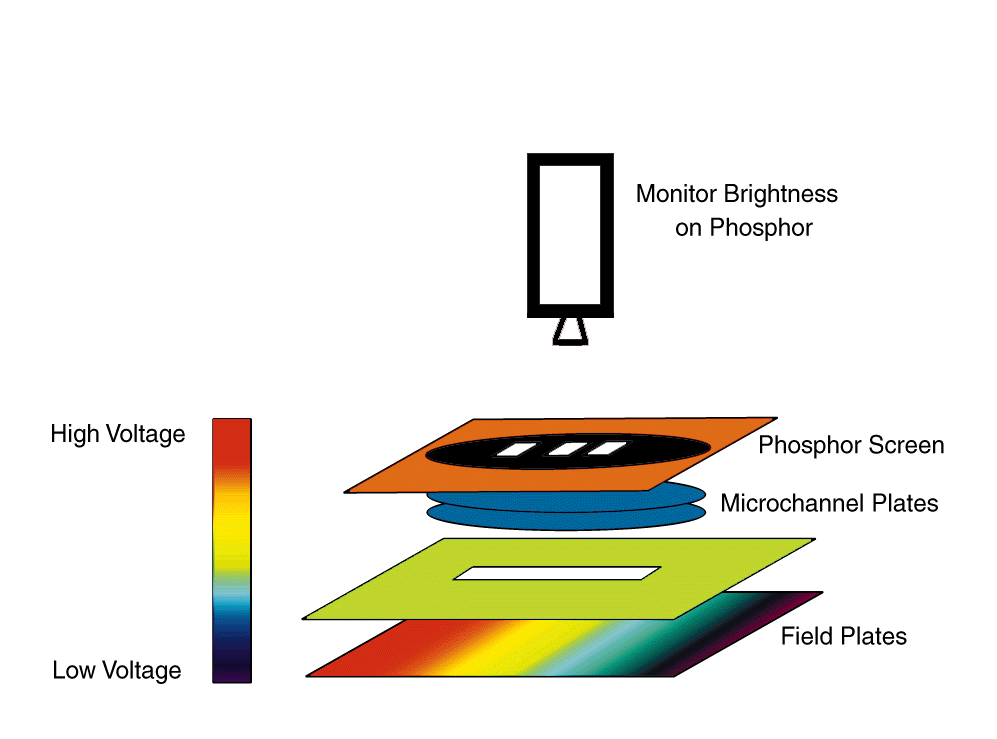
In order to get a measure of the number of ions produced as a function of laser frequency, we need a setup that will allow us to apply an electric field in the interaction region as well as let us collect the ions that are produced by the field pulse. This has been achieved by applying a potential difference between two parallel conducting plates with a thin 1/16² slit in the top plate.
By aligning the lasers along the length of the slit, we make sure that most of the atoms that interact with the laser and get ionized by the field pulse can be extracted out of the interaction region through the slit. To get the ions out through the slit, there is a pair of microchannel plates with the lower plate at high negative voltage and the upper plate grounded. When the accelerated positive ions strike the microchannel plates, they release electrons that are attracted by the high positive voltage on the phosphor screen. The electrons striking the phosphor lose energy and the phosphor fluoresces. The intensity of the fluorescence gives a direct measure of the number of ions produced along the slit.
The method of obtaining a Stark map that has been in use until now consists of applying various fixed potential differences between the plates while varying the laser frequency. The main problem with this method can be seen from a typical Stark map, generated by a different group using the old method, which is displayed here. One has to scan the laser in an identical manner at a very large number of different fields. This not only takes a long time but also misses the finer details of the variations in energy levels over small variations in field. It is with the purpose of improving this method of generating Stark maps that we have developed variations of our detector to enable us to scan over the field as well as the frequency in a continuous manner.
Instead of using plates parallel to each other that produce a uniform field along the slit, we have used plates that are kept at an angle with respect to each other so that the distance between the plates varies linearly along the slit. By aligning the laser along the bisector of the angle between the plates, we can let the atoms experience a linear field gradient along the length of the slit. Whenever we use non-parallel plates to apply a field, the field is expected to have some curvature everywhere except along the center of the angular separation between the plates. In order to minimize this possible source of error and to have a more precise control over the variation of field along the slit, we have developed another variation of the detector. In this case, we use a flat cable with each wire maintained at a constant potential difference with respect to the one next to it. This cable is then placed parallel to the top plate containing the slit and oriented perpendicular to the slit so that there is a constant field gradient along the slit. We have used a resistor chain to keep the wires at fixed potentials. The field gradient can be adjusted by varying the potential difference across the ends of the cable.
Now, if one looks at the signal on the phosphor screen, the direction of the slit represents the field axis and as one scans the laser frequency at a constant rate, time can represent the frequency axis. Plotting the signal strength seen on the phosphor screen as a function of time then gives a two dimensional picture which represents the Stark map of sodium.
Conclusions and Future Prospects
This experiment has been able to demonstrate the effectiveness of a new method of collecting data for atomic spectroscopy. There is scope for improvement in the methods developed here by developing better methods of calibration of the data as well as combining data from different scans of the laser frequency in a mutually compatible manner.
The continuous nature of the data that is possible to be obtained by this method allows for accurate theoretical calculations that have had to depend on discrete data points previously. One area of study that can gain tremendously from this experiment is the modeling of atomic orbits using closed orbit theory, which uses Fourier transforms of scaled action as a function of field.
This Experiment is being performed by
Santosh Pisharody
Jason Zeibel
Svyatoslav Tkachenko
Advisor: R. R. Jones
This poster has been made by Santosh Pisharody and Jason Zeibel.
Acknowledgements
We would like to thank Tom Bensky for developing the data collection software that was used in this experiment, and Matt Campbell who generated the theoretical Stark Map of Sodium.
This project has been funded by AFOSR and the Packard Foundation.