Cell Data Table
Last updated 18:30 - 10/20/01 - js.
General Data
|
Date |
Cell (25 cm) |
Lifetime |
He
Dens |
Wall
AD |
Wall
EH |
Win
A |
Win
B |
Location |
|
13-Feb-01 |
Sally |
53 |
10.85 |
1.41 |
1.35 |
124 |
121 |
JLab |
|
11-Oct-00 |
Gore |
49 |
9.10 |
(1.43) |
(1.34) |
126 |
132 |
JLab |
|
1-May-01 |
King William VIII |
48 |
(7.60) |
1.35 |
1.35 |
75 |
103 |
JLab |
|
11-Oct-00 |
Bush |
47 |
8.96 |
1.41 |
1.39 |
131 |
121 |
JLab |
|
27-Jun-01 |
Tilghman |
44 |
(8.28) |
1.33 |
1.45 |
144 |
152 |
JLab |
|
31-May-01 |
Queen Mary IX |
34 |
(9.00) |
|
|
|
|
UVa |
|
07-Mar-98 |
Grigori |
30 |
(9.14) |
|
|
|
|
UVa |
|
|
|
hours |
amagat |
mm |
mm |
micron |
micron |
|
|
Date |
Cell (40 cm) |
Lifetime |
He
Dens |
Wall
AD |
Wall
EH |
Win
A |
Win
B |
Location |
|
12-Dec-00 |
Virginia One |
69 |
7.93 |
1.37 |
1.45 |
154 |
124 |
JLab |
|
01-Apr-01 |
Shapiro |
64 |
(8.45)
|
1.39 |
1.41 |
117 |
127 |
JLab |
|
11-Apr-01 |
Duke |
55 |
9.18 |
1.41 |
1.38 |
108 |
137 |
JLab |
|
21-Jul-00 |
Guede |
48 |
(10.14) |
|
|
|
|
UVa |
|
13-Dec-98 |
Exodus |
44 |
(9.37) |
|
|
|
|
JLab |
|
07-Feb-99 |
Brunhilde |
40 |
(8.66) |
|
|
|
|
UVa |
|
23-Oct-98 |
Sysiphos (1720) |
33 |
(8.18) |
|
|
|
|
JLab |
|
25-Sep-00 |
Noname |
30 |
(8.83) |
|
|
|
|
UVa |
This is the current list of cells that could be used in the experiments this summer. Most numbers are from characterizations done at UVa.
All lifetime numbers have been corrected for AFP Loss if possible. Throughout this document, numbers enclosed in () are in some way incomplete.
Data is posted as it is taken. The most up-to-date data & raw data can be attained by emailing me at (Jaideep Singh) js7uq@virginia.edu.
Lifetime & Density Data
|
Date |
Cell (25 cm) |
Lifetime |
L
wall+ other |
LHe-He
Dipole |
He3
<Dens> |
He3
D1 |
He3
D2 |
He3
<D1/D2> |
He3
Fill |
N2
Fill |
Vol |
|
13-Feb-01 |
Sally |
53 |
233 |
69 |
10.85 |
11.06 |
10.81 |
10.94 |
10.76 |
0.0902 |
164.1 |
|
11-Oct-00 |
Gore |
49 |
122 |
82 |
9.10 |
9.18 |
9.04 |
9.11 |
9.08 |
0.0685 |
171.9
|
|
1-May-01 |
King William VIII |
48 |
(94) |
(98) |
(7.60) |
(7.60) |
(7.59) |
(7.60) |
(7.60) |
(0.0750) |
183.8 |
|
11-Oct-00 |
Bush |
47 |
108 |
83 |
8.96 |
8.87 |
8.88 |
8.87 |
9.04 |
0.0750 |
173.7 |
|
27-Jun-01 |
Tilghman |
44 |
(86) |
(90) |
(8.28) |
(8.26) |
(8.25) |
(8.26) |
(8.30) |
(0.0750) |
173.5 |
|
31-May-01 |
Queen Mary IX |
34 |
(58) |
(83) |
(9.00) |
|
|
|
(9.00) |
(0.0750) |
(163.0) |
|
07-Mar-98 |
Grigori |
30 |
(48) |
(81) |
(9.14) |
(9.14) |
|
(9.14) |
|
|
180.7 |
|
|
|
hours |
Hours |
hours |
amagat |
amagat |
amagat |
amagat |
amagat |
amagat |
cc |
|
Date |
Cell (40 cm) |
Lifetime |
L
wall+ other |
LHe-He
Dipole |
He3
<Dens> |
He3
D1 |
He3
D2 |
He3
<D1/D2> |
He3
Fill |
N2
Fill |
Vol |
|
12-Dec-00 |
Virginia One |
69 |
260 |
94 |
7.93 |
7.95 |
7.95 |
7.95 |
7.90 |
0.1030 |
195.0
|
|
01-Apr-01 |
Shapiro |
64 |
(234) |
88 |
(8.45)
|
(8.40) |
(8.39) |
(8.40) |
(8.50)
|
(0.0850) |
(201.6)
|
|
11-Apr-01 |
Duke |
55 |
171 |
81 |
9.18 |
9.21 |
9.23 |
9.22 |
9.13 |
0.0846 |
199.9 |
|
21-Jul-00 |
Guede |
48 |
(139) |
(73) |
(10.14) |
|
|
|
10.14 |
0.0805 |
197.3 |
|
13-Dec-98 |
Exodus |
44 |
(99) |
(79) |
(9.37) |
|
|
|
(9.37) |
(0.0865) |
(199.3) |
|
07-Feb-99 |
Brunhilde |
40 |
(75) |
(86) |
(8.66) |
|
|
|
8.66 |
|
197.4 |
|
23-Oct-98 |
Sysiphos (1720) |
33 |
(52) |
(91) |
(8.18) |
|
|
|
(8.18) |
(0.0873) |
(212.1) |
|
25-Sep-00 |
Noname |
30 |
(47) |
(84) |
(8.83) |
|
|
|
8.83 |
|
193.5 |
The lifetime is the inverse of the total relaxation rate. The total relaxation rate is a sum of the relaxation rates due to the He-He Dipole interaction, wall relaxation and other mechanisms. The He-He dipole
interaction is the fundamental limiting mechanism for the polarization and is proportional to the He density. Thus to compare the “quality” to two cells which have different densities, the relaxation due to the
He-He dipole interaction is removed from the total lifetime leaving L wall+other. The fill numbers come from calculating the number of particles of gas put into the cell divided by the volume measured
using Archimedes Principle. The pressure broadening density is attained from fitting the Rb absorption lines at D1 – 795nm and D2 – 780nm to an asymmetric Lorentzian lineshape. From the fit we extract
the width of the lineshape which is linearly proportional to the density of the perturbing gases in the cell. Broadening due to the Doppler effect, wall collisions, and collisions with other Rb atoms are tiny
and therefore neglected. However, the raw data is corrected for the temperature of the cell and for the broadening due to collisions with N2. Each are <= 1% corrections.
A Sample Pressure Broadening scan of Tilghman can be found here.
Window Thickness (in microns)
|
Date |
Cell (25 cm) |
A
mark |
A
mech |
A
opt |
B
mark |
B
mech |
B
opt |
|
13-Feb-01 |
Sally |
10 |
(123) |
124 |
11 |
(123) |
121 |
|
11-Oct-00 |
Gore |
7 |
|
126 |
10 |
|
132 |
|
1-May-01 |
King William VIII |
119 |
|
75 |
120 |
|
103 |
|
11-Oct-00 |
Bush |
5 |
|
131 |
13 |
|
121 |
|
27-Jun-01 |
Tilghman |
2 |
(136) |
144 |
18 |
(146) |
152 |
|
31-May-01 |
Queen Mary IX |
|
|
|
|
|
|
|
07-Mar-98 |
Grigori |
B or R |
|
|
I |
|
|
|
|
|
|
|
|
|
|
|
|
|
|
|
micron |
micron |
|
micron |
micron |
|
Date |
Cell (40 cm) |
A
mark |
A
mech |
A
opt |
B
mark |
B
mech |
B
opt |
|
12-Dec-00 |
Virginia One |
4 |
|
154 |
9 |
|
124 |
|
01-Apr-01 |
Shapiro |
7 |
(118) |
117 |
19 |
(128) |
127 |
|
11-Apr-01 |
Duke |
22 |
(105) |
108 |
24 |
(132) |
137 |
|
21-Jul-00 |
Guede |
7 |
|
|
10 or 16 |
|
|
|
13-Dec-98 |
Exodus |
C |
|
|
E |
|
|
|
07-Feb-99 |
Brunhilde |
B |
135 |
|
C |
132 |
|
|
23-Oct-98 |
Sysiphos (1720) |
|
|
|
|
|
|
|
25-Sep-00 |
Noname |
6 |
|
|
11 |
|
|
A systematic error of about +18 microns was found in the mechanical measurements made using the micrometer setup in the Glass Shop at UVa. Therefore the “corrected”
data is listed enclosed in (). The values for King William are abnormally low. They have been retested and the same values were found (to within in 2 microns). Window A is typically
the window with the smaller numerical value for the mark. For example the marks on the windows of Virginia One are 4 and 9 making 4 window A.
A Sample Plot of a window thickness scan of Gore can be found here.
Wall Thickness (in mm)
|
Cell (25 cm) |
<AD> |
A
opt |
B
opt |
C
opt |
D
opt |
<EH> |
E
opt |
F
opt |
G
opt |
H
opt |
|
|
|
Sally |
1.41 |
1.49 |
1.42 |
1.48 |
1.25 |
1.35 |
1.45 |
1.40 |
1.33 |
1.23 |
|
|
|
Gore |
1.43 |
1.32 |
1.34 |
1.54 |
1.51* |
1.34 |
1.31 |
|
|
|
|
|
|
King William VIII |
1.35 |
1.32 |
1.30 |
1.34 |
1.42 |
1.35 |
1.36 |
1.32 |
1.31 |
1.40 |
|
|
|
Bush |
1.41 |
1.33 |
1.42 |
1.43 |
1.47 |
1.39 |
1.30 |
1.44 |
1.42 |
1.38 |
|
|
|
Tilghman |
1.33 |
1.31 |
1.35 |
1.33 |
1.33 |
1.45 |
1.43 |
1.44 |
1.43 |
1.48 |
|
|
|
Queen Mary IX |
|
|
|
|
|
|
|
|
|
|
|
|
|
Grigori |
|
|
|
|
|
|
|
|
|
|
|
|
|
|
mm |
mm |
mm |
mm |
mm |
mm |
mm |
mm |
mm |
mm |
mm |
mm |
|
Cell (40 cm) |
<AD,I> |
A
opt |
B
opt |
C
opt |
D
opt |
<EH,J> |
E
opt |
F
opt |
G
opt |
H
opt |
I opt |
J opt |
|
Virginia One |
1.37 |
1.38 |
1.40 |
1.34 |
1.36 |
1.45 |
1.41 |
1.41 |
1.38 |
1.64 |
1.38 |
1.41 |
|
Shapiro |
1.39 |
1.40 |
1.41 |
1.38 |
1.37 |
1.41 |
1.38 |
1.45 |
1.45 |
1.31 |
1.38 |
1.44 |
|
Duke |
1.41 |
1.52 |
1.38 |
1.37 |
1.38 |
1.38 |
1.42 |
1.47 |
1.42 |
1.22 |
1.42 |
1.39 |
|
Guede |
|
|
|
|
|
|
|
|
|
|
|
|
|
Exodus |
|
|
|
|
|
|
|
|
|
|
|
|
|
Brunhilde |
|
|
|
|
|
|
|
|
|
|
|
|
|
Sysiphos (1720) |
|
|
|
|
|
|
|
|
|
|
|
|
|
Noname |
|
|
|
|
|
|
|
|
|
|
|
|
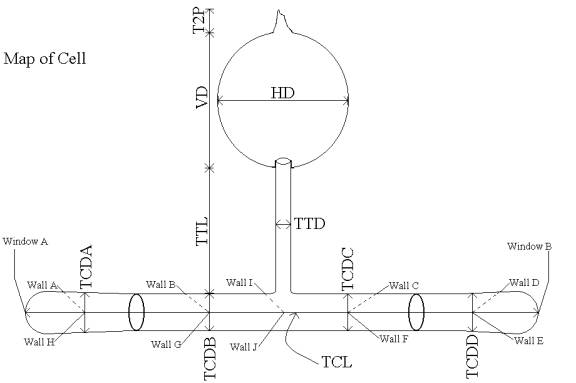
Not all measurements have been made for all cells. Positions vary by at most 20 mm from cell to cell. This means that spot “A” on Bush is within 2 cm of spot “A” on Gore.
Position varies by at most 15 mm between wall thickness measurement and tubing diameter measurement for a given cell. This means that the position of wall thickness A, wall thickness
H, and target chamber diameter A are all within 15 mm of each other on Bush.
The following are just rough positions. More detailed positions are recorded for each cell.
<AD(,I)> is the average of the wall thickness measurements for one side of the 25cm (40cm) cell.
<EH(,J)> is the average of the wall thickness measurements for the other side of the 25cm (40cm) cell.
A and H are on opposite sides of the same window.
D and E are on opposite side of the other window
B and C are on the same side of the target chamber separated by the transfer tube.
F and G are on the opposite side of the target chamber separated by the transfer tube.
I and J are measured at the center of the target chamber on either side (for 40 cm cells only).
For Gore, D* was measured at the joint between window 7 and the main target body.
A diagram depicting the rough location of each spot is shown above.
Cell Dimensions (in mm)
|
Cell (25 cm) |
VD |
HD |
T2P |
TTL |
TTD |
TCL |
TCDA |
TCDB |
TCDC |
TCDD |
TCDE |
<TCD> |
|
Sally |
65.0 |
63.2 |
28.4 |
66.6 |
11.3 |
255 |
19.5 |
19.0 |
19.0 |
19.3 |
|
19.2 |
|
Gore |
(68.1) |
(64.5) |
|
(66.5) |
(11.2) |
(259) |
|
(18.8) |
|
|
|
(18.8) |
|
King William VIII |
62.6 |
65.4 |
25.2 |
57.2 |
11.4 |
249 |
19.3 |
19.4 |
19.6 |
19.2 |
|
19.4 |
|
Bush |
67.0 |
64.0 |
28.2 |
63.6 |
11.6 |
259 |
19.3 |
18.8 |
18.8 |
19.3 |
|
19.1 |
|
Tilghman |
68.8 |
64.5 |
21.6 |
64.6 |
11.8 |
250 |
19.4 |
19.3 |
19.3 |
19.2 |
|
19.3 |
|
Queen Mary IX |
62.6 |
62.1 |
22.0 |
58.0 |
11.7 |
250 |
19.5 |
19.6 |
19.7 |
19.5 |
|
19.6 |
|
Grigori |
|
|
|
|
|
|
|
|
|
|
|
|
|
|
mm |
Mm |
mm |
mm |
mm |
mm |
mm |
mm |
mm |
mm |
|
|
|
Cell (40 cm) |
VD |
HD |
T2P |
TTL |
TTD |
TCL |
TCDA |
TCDB |
TCDC |
TCDD |
|
|
|
Virginia One |
67.4 |
63.4 |
36.2 |
65.2 |
10.6 |
397 |
18.5 |
19.2 |
19.1 |
19.2 |
|
19.0 |
|
Shapiro |
65.2 |
64.8 |
28.6 |
64.6 |
11.1 |
397 |
19.1 |
18.8 |
18.8 |
19.3 |
|
19.0 |
|
Duke |
70.0 |
64.5 |
23.0 |
65.6 |
11. |
394 |
19.1 |
19.1 |
19.1 |
19.3 |
|
19.2 |
|
Guede |
67.8 |
63.3 |
43.0 |
64.8 |
11.1 |
394 |
19.0 |
19.3 |
19.6 |
18.9 |
|
19.2 |
|
Exodus |
(65.2) |
(62.7) |
|
(64.8) |
(11.8) |
(396) |
|
(18.8) |
|
|
|
(18.8) |
|
Brunhilde |
(67.8) |
(63.5) |
|
(66.0) |
(11.2) |
(397) |
|
(18.2) |
|
|
|
(18.2) |
|
Sysiphos (1720) |
|
|
|
|
|
|
|
|
|
|
|
|
|
Noname |
|
|
|
|
|
|
|
|
|
|
|
|
VD – vertical diameter of pumping chamber, equivalent to distance from top of pumping chamber to top of transfer tube
HD – horizontal diameter of pumping chamber
T2P – tipoff length, equivalent to distance from top of tipoff to top of pumping chamber
TTL – transfer tube length, equivalent to distance from bottom of pumping chamber to top of target chamber
TTD – transfer tube diameter
TCL – target chamber length, this is measured from tip of window to tip of window
TCDA – target chamber diameter on window tube
TCDB – target chamber diameter past window to main tube seal
TCDC – target chamber diameter past the transfer tube but before main tube to window tube seal
TCDD – target chamber diameter on opposite window tube
TCDE – target chamber diameter on the middle of the target chamber.
<TCD> - average target chamber diameter
“tops” and “bottoms” are arbitrary, however, every attempt is made to measure each cell using the same criteria for “top” and “bottom.
A diagram of this is shown above.
Cell Volumes (in cc)
|
Cell (25 cm) |
Pumping
Chamber |
Transfer
Tube |
Target Chamber |
Measured Volume |
External Volume |
|
Sally |
109.9 |
3.2 |
51.0 |
164.1 |
|
|
Gore |
(119.8) |
(3.1) |
(49.0) |
171.9
|
218.6 |
|
King William VIII |
125.2 |
3.0 |
55.6 |
183.8 |
|
|
Bush |
119.6 |
3.3 |
51.2 |
173.7 |
|
|
Tilghman |
121.4 |
2.7 |
49.5 |
173.5 |
223.1 |
|
Queen Mary IX |
101.3 |
3.0 |
51.7 |
156.0 |
|
|
Grigori |
|
|
|
180.7 |
|
|
|
Cc |
cc |
cc |
cc |
|
|
Cell (40 cm) |
Pumping
Chamber |
Transfer
Tube |
Target Chamber |
Measured Volume |
|
|
Virginia One |
114.9 |
2.5 |
77.6 |
195.0
|
257.5 |
|
Shapiro |
119.1 |
3.0 |
79.6 |
(201.6)
|
262.7 |
|
Duke |
121.1 |
2.9 |
75.9 |
199.9 |
|
|
Guede |
(115.5) |
(2.9) |
(78.9) |
197.3 |
|
|
Exodus |
(115.3) |
(3.7) |
(80.3) |
(199.3) |
|
|
Brunhilde |
(121.1) |
(3.2) |
(73.2) |
197.4 |
|
|
Sysiphos (1720) |
|
|
|
212.1 |
|
|
Noname |
|
|
|
193.5 |
|
|
|
|
|
|
|
|
|
Errors |
3% |
3% |
3% |
0.3 |
0.3 |
Where one section ends and another starts is arbitrary, however, every attempt is made to measure each cell using the same criteria.
A simple geometric model is used to calculate the internal volume from the external dimensions. The thickness used in the calculations are:
1.93mm for the pumping chamber wall and 1.73mm for the transfer tube wall. These calculated volumes are then scaled to sum to the
internal cell volume measured from Archimedes principle. The calculated volume differs from the actual measured volume by no more than 5%.
Reference and Water Cell Data (will be up eventually)
Density of GE 180
The density used in the calculations was measured from a Mike made cell that broke during the fill. The measured density and error is 2.749 +/- 0.005 g/cm^3.
GE claims 2.764 and 2.77 in their literature.
General Notes on Cells
- Sally was over filled by 2 amagats due to a problem with the liquid Helium supply.
- The fill temp of Gore, Bush, and Virginia One have been lost. Therefore, the fill density errors for these cells will be higher than the rest of the cells.
- The fill data for Grigori has been lost, so there is no fill density for Grigori.
- Rex Helios and Jagr have both exploded, and Lemiuex has a lifetime of only 19 hrs. Therefore, these cells are not listed.
- Virginia One may not have been adequately pressure tested.
- Shapiro is a W&M cell made by Mike Souza with Mike’s glass.
- King William is a W & M cell made by Mike + Willie with Mike’s glass.
- Queen Mary is a W& M cell made by Willie Shoup with Willie’s glass.
- Sysiphos is the only cell that has seen beam before this set of experiments.
- Sysiphos is the only Corning 1720 cell. The rest are GE 180.
- Noname is of dubious heritage.
- Acceptable window size range is 120-150 microns.
- The mechanical measurement of the windows done at UVa has a consistent systematic shift of +18 microns.
- Reference Cell #1 was not characterized at all at UVa.
- Reference Cell #2 is made partly of Mike’s glass and partly of Willie’s glass.
- Difference between Mike’s glass and Willie’s glass include the fact that Willie’s glass has a larger diameter, is thicker by about 20%, and shows a greater variation after resizing.
- Because of the glass fabrication process, the stock tubing used to make the glass has thicknesses on one side that are thicker than the other side. When the glass is resized, this thickness variation is to some degree made into a spiral down the axis of the target chamber.
- Tilghman is made from Mike’s glass at W&M.