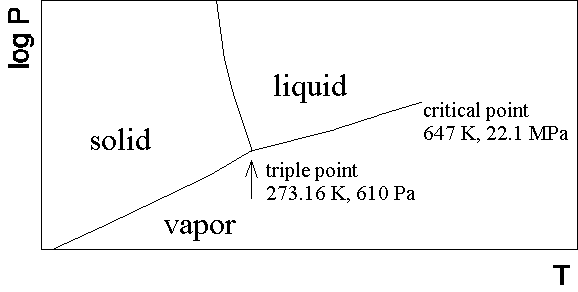
A phase diagram for a typical pure substance in the pressure (p) temperature (T) plane is sketched below.
Figure 2.2: Pressure-temperature phase diagram of water. Recall that 1.0135MPa = 10 atm.
A close view of the triple point is in footnote
(1).
There are three equilibrium phases, the solid (s), liquid (l), and vapor (v) (or gas), with phase boundaries separating the phases. Crossing the phase boundaries results in a phase transitioni from one phase to the other. The liquid-vapor phase boundary (often called the vaporization curve), terminates in a critical point at sufficiently high temperatures and pressures. At temperatures above the critical temperature or pressures above the critical pressure there is no distinction between the vapor and liquid phases, and we have simply a single fluid phase. Indeed, at a microscopic level there is little difference between a liquid and a vapor; there are stronger interactions between the particles in the liquid, but there are no fundamental differences in symmetry between the two phases. Our description of fluid mechanics will apply equally well to liquids and vapors (gases).
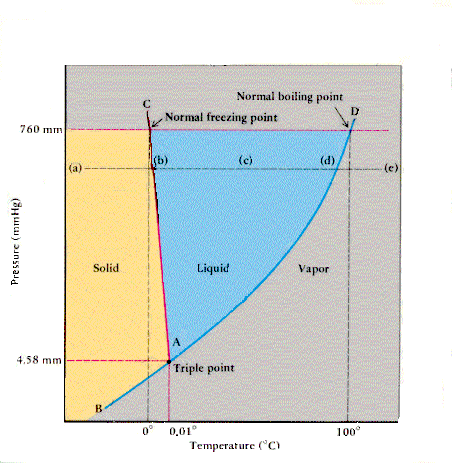
Footnote:(1) Actually, the phase diagram of water is atypical in that the liquid-solid phase boundary line has a negative slope. This is a consequence of the fact that liquid water has a density greater than ice, while usually the solid is denser than the liquid. As seen in the figure below, the triple point is very close in temperature to the normal freezing point, but it occurs at a pressure much lower than atmospheric pressure. (Figure taken from Kotz & Purcell, Chemistry & Chemical Reactions, second edition.)